Summary
- Two sigma events are a rarity and have coincided with periods that have produced poor long term returns.
- Utilizing two standardized values, CAPE and trailing 5-year returns, these metrics have captured all significant equity market bubbles. We are currently in two sigma territory.
- Markets can endure beyond the two sigma signals and, with unusual Fed policy, it can continue to do so.
- However, it is important to be aware that 10-year risk adjusted returns have been negative beyond these signals and long term investors should plan accordingly.
- Also, aggregate profits have suffered a significant decline in Q1, and the historical implications are poor moving forward.
Jeremy Grantham designates a bubble, using various metrics, as two standard deviations from their respective means. We have created our own metric in the graph below, which is the adjusted, standardized CAPE plus standardized trailing 5-year return.
(click to enlarge)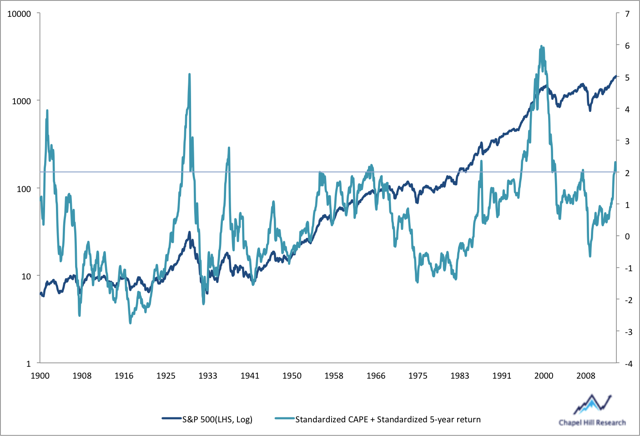
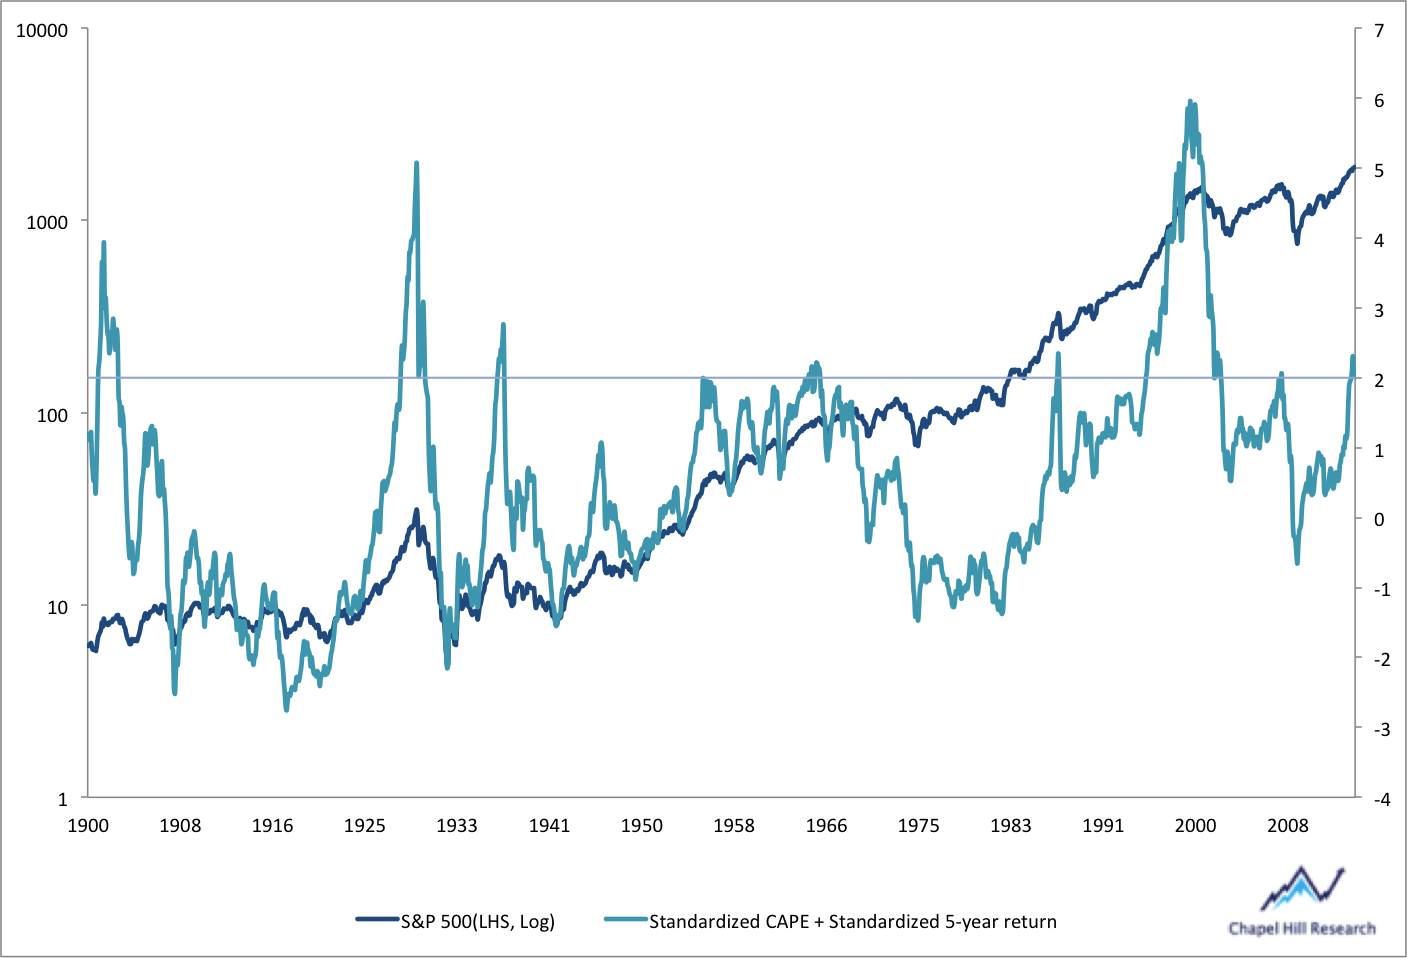
These events occurred in '29, '37, '65, '87, '95-'00, '07, and now '14. As you would presume, it never ends well. The average 10-year return in excess of Treasuries of similar duration after these two-sigma events is -2.02% a year. This is including '87 when the market plummeted abruptly and then proceeded to march higher. Surely, as validated by the '65 and '00 bubble, the market can endure and move to the upside in the short term. However, for us long term investors, this is dispiriting information.
Also, aggregate corporate profitability plummeted -6.8% year-over-year in the first quarter of this year.